Sample
Here is a sample of the Student Manual:
IND-24 (Part A). Identifying Unknowns by Electrophoresis
Background Information
Many different types of biological molecules are charged at neutral pH as shown in the table below. For example, four of the twenty amino acids found in proteins are charged. The basic amino acids lysine and arginine carry a positive charge while the acidic amino acids aspartate and glutamate carry a negative one. Likewise synthetic dyes, which are similar in size to amino acids, are often acidic or basic. These dyes are commonly used to stain tissue sections, as food coloring agents and for coloring fabrics in the clothing industry. Proteins are composed of amino acids and thus basic proteins are generally rich in lysine and arginine and deficient in aspartate and glutamate while the reverse is true for acidic proteins. DNA and RNA molecules always carry a negative charge at neutral pH because of the negatively charged phosphate backbone.
Electrophoresis is the movement of charged molecules under the influence of an electric field. Since many biological molecules carry a charge, they can be separated by this technique. A diagram of the essential components of an agarose electrophoretic system is shown in Figure 1. The agarose gel, containing preformed sample wells, is submerged in buffer, which is contained within the electrophoretic chamber. Samples to be separated are then loaded into the sample wells of the gel. Current from the power supply travels to the negative electrode (cathode), supplying electrons to the conductive buffer solution, gel, and positive electrode (anode), thus completing the circuit.
Agarose is a natural polysaccharide of galactose and anhydrogalaclose derived from agar, which in turn is obtained from certain marine red algae. The agarose gel is an ideal solid support for the separation of proteins and smaller dyes and amino acids on the basis of charge and for the separation of DNA fragments on the basis of size as illustrated in Figure 2. The pore size of a low percentage agarose gel (1%) is much larger than the size of amino acids, dyes and proteins. Thus, the gel can be viewed as a sponge, which has pores large enough to allow even the largest proteins to pass unimpeded. Under these conditions, acidic amino acids (glutamic acid and aspartic acid), acidic dyes and acidic proteins (which have high concentrations of acidic amino acid residues) migrate toward the positive electrode and basic amino acids (lysine acid and arginine), basic dyes and basic proteins (which have high concentrations of basic amino acid residues) migrate toward the negative electrode. In contrast, the size of DNA fragments is similar to the size of a gel pore and the gel acts like a sieve and sorts the negatively charged fragments according to size with the smaller fragments migrating faster than the larger ones.
The basic electrophoretic system described above can be altered in order to separate proteins on the basis of size. In this application, proteins are first denatured with the detergent sodium dodecyl sulfate (SDS), which renders all proteins negatively charged. The denatured proteins are then electrophoresed on gels with a pore size that is smaller than that seen in a 1% agarose gel. Thus, the gel serves as a sieve with the smaller proteins migrating faster than the larger ones. High percentage agarose gels (5¬6%) and gels made from polyacrylamide are commonly used for this purpose.
Objective: To identify unknown dye molecules by electrophoresis
Materials
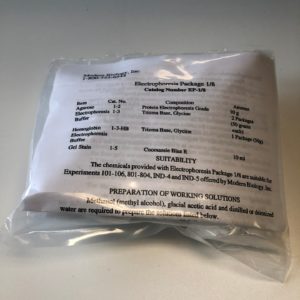
I. The solutions and materials required for electrophoresis and sample handling (see Instructor Guide).
H. The four dye samples labeled 1-4. The dyes in these samples are listed below.
Sample 1. Bromophenol Blue, Orange G and Xylene Cyanole. Sample 2. Cibacron Blue and Phenol Red
Sample 3 Toluidine Blue
Sample 4. To be determined in this exercise.
Procedure
The procedures for the preparation and electrophoresis are briefly outlined below. This experiment was designed such that the samples of two students will be analyzed on one agarose gel. If the students work in pairs, four students will share one gel. The experiments of each student (or student pair) will be electrophoresed on four gel lanes. The procedures described below were written for using the equipment from Modern Biology Inc. where the gel size is 2 inches by 3 inches and there are 8 sample wells per gel. For other gel sizes, the procedure needs to be revised accordingly.
I. Preparation of 1.2 % Agarose gels
1. Place the casting tray on a level work surface and place a precleaned glass slide into the support deck.
2. Seal both ends of the gel support deck with tape.
3. Dispense 15 ml of the electrophoresis buffer into a glass test tube and add 0.18 grams of agarose. If a balance is not available, 0.18 grams of agarose can be estimated by filling a 0.5 ml microcentriftige tube with agarose until two-thirds full. Gently swirl the glass tube until the agarose forms a suspension.
4. Place the test tube into a boiling water bath and allow the agarose suspension to come to a vigorous boil.
5. After boiling for about 2-3 minutes, remove the tube from the bath and pour the melted agarose onto the casting deck.
6. After the gel has cooled for about 10-15 minutes, remove the tape strips and comb and transfer the gel tray to the electrophoresis chamber so that the sample wells are nearest to the black (negative) electrode.
7. Slowly fill the electrophoresis chamber with electrophoresis buffer until the gel is covered with about a lcm layer of buffer.
II. Electrophoresis
1. Load 10 ul of each of the four samples into the sample wells as indicated below.
Sample Well Number
1. Sample 1
2. Sample 2
3. Sample 3
4. Sample 4
5. Sample 1
6. Sample 2
7. Sample 3
8. Sample 4
Student Group 1
Student Group 2
2. Electrophorese at 170 volts (for the large Procell Unit) or 85 Volts (for the smaller Biocell Unit).
3. During the first 6-8 minutes of electrophoresis, watch the gel closely in order to determine the direction of migration (toward the positive or negative electrode) of the dyes in each sample. If necessary, remove the lid of the electrophoresis unit and note the relative position of the dyes as compared to their point of application at the sample wells.
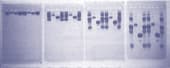
4. Resume electrophoresis for an additional 30 minutes. Remove the gels from the unit and measure the distance of each dye (in cm) from the sample wells.
Data Analysis
1. In the table below, record the distances migrated by each dye.
2. Indicate the relative charge of each dye molecule in the table.
(Use — for slightly negative, — for moderately negative, —for very negative and + for positive).
3. Identify the three dyes in sample 4 by their colors and by their electrophoretic motilities.
Table 2. Analysis of the Data
Dyes Color Distance Migrated (cm) Relative Charge
Sample 1
Bromophenol Blue Blue-Purple
Orange G Orange
Xylene Cyanole Blue
Sample 2
Cibacron Blue Blue
Phenol Red Red
Sample 3
Toluidine Blue Blue
Sample 4
Orange Red Blue
IND-24 (Part B). Identifying Dyes that Bind to DNA
The concept that chromosomal units known as genes transmit heritable information from parent to offspring was founded in the late 19th century. However, a description of genes in terms of their unique structural and functional properties is relatively new. We now know that genes are composed of a type of nucleic acid called deoxyribonucleic acid (DNA). The DNA molecule not only directs its own reproduction but also stores all the information that determines the types of proteins produced during the lifetime of an organism. In so doing, DNA orchestrates the complex reactions and structures characteristic of an organism and its offspring. Ribonucleic acid (RNA), the second major category of nucleic acids, is involved principally in the transmission of genetic information and in protein production. The structure and function of DNA and RNA can most easily be understood by examining the chemical composition of the nucleic acids.
Nucleotides—Building Blocks of Nucleic Acids
Under the proper conditions, nucleic acids can be broken down to low- molecular weight products of three types: a pentose (or 5 carbon) sugar, purines and pyrimidines; and phosphoric acid (Figure 1). The phosphate group is responsible for the strong negative charge of nucleic acids. The pentose sugar from RNA is always ribose and that from DNA is 2-deoxyribose. These sugars differ only by the presence or absence of a hydroxyl group on carbon 2 (so called 2′). The numbers assigned to the five carbon atoms are shown in Figure 1. The purines and pyrimidines are often called nitrogenous bases (or, simply, bases). The major purine bases in DNA and RNA are adenine (A) and guanine (G), and the major pyrimidines in DNA are cytosine (C) and thymine (T). RNA contains the base uracil (U) in place of thymine. The sugars and phosphates are readily soluble in water. That is, they are hydrophilic. In contrast, the bases are hydrophobic in that they display limited solubility in water. As will be discussed below, these differences in water solubility are extremely important for the structure of the DNA molecule.
A nucleotide consists of a pentose sugar, a nitrogenous base and a phosphate group structured as shown below. The high-energy storage compound, adenosine triphosphate (ATP), is a well-known nucleotide found in biological systems.
Base
Sugar—Phosphate
The Polynucleotide Chain
Nucleic acids are polyoucleotides and have the general structure shown below:
Base Base Base
I 1 1
—Sugar—Phosphate—Sugar—Phosphate—Sugar
A polynucleotide is composed of repeating nucleotide units linked into chains by phosphodiester bonds that join the 5′ carbon of one ribose or deoxyribose group to the 3′ carbon of the next sugar (Figure 2). The sequence or order of nucleotides in a polyonucleotide chain is often abbreviated by a 1-letter code (e.g., 0-C-A-T-A) with the 5′ end of the chain written at the left. A typical RNA molecule is a single-stranded polyoucleotide chain. As will be described below, DNA usually contains two polynucleotide strands coiled around one another to form a double-stranded helix. The number of nucleotide units in a nucleic acid chain varies tremendously depending on the nucleic acid type. For example, each chromosome from a higher organism is thought to contain a single, very long DNA molecule. A DNA molecule from the largest human chromosome is composed of approximately 5.4 x 10⁸ nucleotides, which corresponds to a molecular weight of the order of 10″ and a length of about 4 cm. On the other hand, transfer RNA molecules generally contain only 70-80 nucleotides.
Figure 2. Structure of the Polynucleotide Chain
Proteins that bind to DNA control the processes of transcription and replication. Most of these regulatory proteins interact in the DNA major groove where a portion of the protein sits in the groove and interacts with chemical groups on the bases. A lesser number of regulatory proteins interact with the DNA minor groove and one such protein controls the development of the testicles and ovaries in humans. Some small molecular drugs also interact with the DNA minor groove and these drugs have been used in the treatment of cancer. Other drugs interact with the bases directly while another class binds to the negatively charged DNA phosphate backbone by electrostatic interactions.
Objective: One of the dyes that you analyzed in the previous experiment should bind to DNA. At this time, write the name of this drug below and state the reason for your choice. You have just advanced a hypothesis and you will determine if your hypothesis is correct in the experiment below.
Your Hypothesis
Materials
1. The solutions and materials required for electrophoresis and sample handling (see The Instructor Guide).
2. The four dye samples labeled 1-4. The dyes in these samples are listed below.
Sample 1. Bromophenol Blue, Orange G and Xylene Cyanole
Sample 2. Cibacron Blue and Phenol Red
Sample 3 Toluidine Blue
Sample 4. Determined in the previous experiment
DNA- The DNA solution must be prepared at least 1 day before this laboratory session as described in the Instructor Guide.
Procedure
The procedures for the preparation and electrophoresis are briefly outlined below. This experiment was designed such that the samples of two students will be analyzed on one agarose gel. If the students work in pairs, four students will share one gel. The experiment of each student (or student pair) will be electrophoresed on four gel lanes.
I. Incubation of Dyes with DNA.
1. Each group should obtain four 0.5 ml microcentrifuge tubes and label them 1-4 with a waterproof marking pen.
2. Place 10 ul of the dyes from sample tubes 1-4 into the correspondingly labeled tubes.
3. Members from 4 of the 8 groups should place 5 ul of water into each tube. These groups will serve as the control groups for the experiment.
4. Members from the remaining 4 groups should place 5 ul of DNA solution into each tube.
5. Mix the contents of each tube by tapping it with the tip of your index finger. II. Preparation of 1.2 %Agarose gels.
Prepare 1.2 % agarose gels as described in the previous section.
Electrophoresis
1. Load 10 .tl of each of the four samples into the sample wells as indicated below.
Sample Well Number
1. Tube 1
2. Tube 2 Control Group
3. Tube 3 (No DNA)
4. Tube 4
5. Tube 1
6. Tube 2 Experimental Group
7. Tube 3 (Contains DNA)
8. Tube 4
2. Electrophorese at 170 volts (for the large Procell ) or 85 Volts (for the smaller Biocell unit).
3. During the first 6-8 minutes of electrophoresis, watch the gel closely in order to determine the direction of migration (toward the positive or negative electrode of the dyes in each sample. If necessary, remove the lid of the electrophoresis unit and note the relative position of the dyes as compared to their point of application at the sample wells.
4. Resume electrophoresis for an additional 30 minutes. Remove the gels from the unit and note the position of each dye relative to the sample wells.
Data Analysis and Study Questions
1. Name the dye that binds to DNA and give the reason for you answer.
2. Describe how this dye binds to DNA and identify the chemical groups on the DNA molecule that most likely interact with the dye.
3. This dye is used to stain cells and tissue sections for microscopy. Name a cell structure that you would expect to be stained preferentially by this dye.
 Due to Customs restrictions, we only accept orders from educational institutions within the Continental United States, Alaska or Hawaii.