Due to Customs restrictions, we only accept orders from educational institutions within the Continental United States, Alaska or Hawaii.


Description
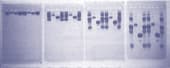
Each protein carries in its amino acid sequence information pertaining to its evolutionary history and origin, and provides clues to the evolutionary history of the organism in which it is found. Indeed, proteins existing today are in effect living fossils. This concept is illustrated in this exercise where eight groups of students examine the abilities of antibodies against cow gamma globulin to react with gamma globulins in the sera of cow, goat, sheep, horse, and chicken. The results of the experiment will enable the student to answer the questions on the right which are posed in the Student Guide provided with the exercise. Answers to these questions are given in the Instructor Guide. The method used for the experiment involves dotting small quantities of serum onto nitrocellulose and then incubating the nitrocellulose with an enzyme-linked antibody against cow gamma globulin. Following development of the nitrocellulose, purple dots appear with intensities that are proportional to the reactivity of the antibody.
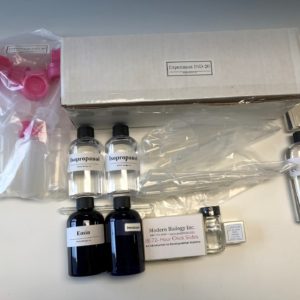
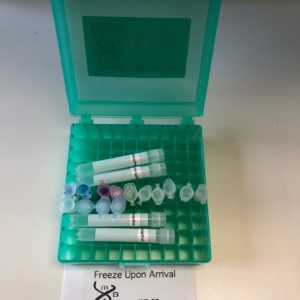
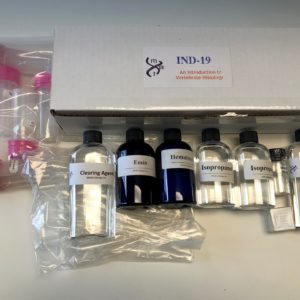
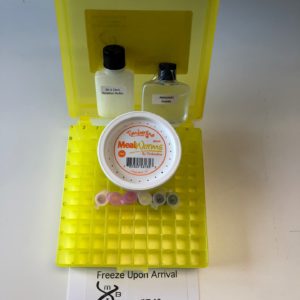
The entire exercise was designed for eight groups of students and can be completed within a 2-hour laboratory period. The package includes: 8 sheets of nitrocellulose, blotting paper, dishes for nitrocellulose incubation, anti-Cow IgG (Peroxidase linked), purified cow IgG, cow serum, horse serum, goat serum, sheep serum, chicken serum, protein blot stain, hydrogen peroxide, chloronapthol, gelatin, Tris buffer, Tris buffer saline (TBS), and TBS+NP-40. Microliter dispensers are needed but not provided and electrophoresis equipment is not required.